The Real Estate Agent’s Guide to Instagram Reels Analytics

Table of Contents
- What are Instagram Reels Analytics?
- Key Instagram Reels metrics to track
- Views
- Watch time
- Average watch time
- Accounts reached
- Engagement rate
- Likes, comments, saves, and shares
- Follows
- Click-through rate
- Conversion rate
- How these metrics connect to your reach on Instagram
- Discovery
- Algorithm insights
- Why You Should Track Reels Analytics
- 1. Know what’s working (and what’s not)
- 2. Get to know the people watching your content
- 3. Post when your audience is actually online
- 4. Connect your content to real results
- 5. Create more of what your audience engages with
- How to Access Instagram Reels Analytics
- Step 1: Switch to a Business or Creator Account
- Step 2: View Insights on a specific Reel
- Step 3: Access analytics via the Insights section
- Bonus: How to fix Reels Insights not showing
- How to use Reels analytics to improve your strategy
- Double down on what’s already working
- Fix low average watch time
- Track new followers per Reel
- Common pitfalls to avoid when reading your Reels analytics
- Confusing reach with views
- Chasing vanity metrics
- Skipping competitor analysis
- Analyzing all your Reels together
- How does the Instagram algorithm rank Reels (and what you can control)?
- Interest
- Timeliness
- Relationship
- Frequency and usage
- Following
- Frequently Asked Questions
- 1. How do I get analytics for a specific Instagram Reel?
- 2. Why do some Reels perform better for real estate listings than others?
- 3. How can I measure ROI from Instagram Reels?
- 4. How do I use Reels insights to improve posting times for real estate audiences?
- 5. Which Reels content types drive the most engagement for realtors?
- 6. Can I access Instagram Reels analytics on a personal account?
- 7. Can I export Instagram Reels analytics data?
If you’re like most agents, you use Instagram Reels sporadically to promote a new listing, to share a market update, or to spotlight a new business in town, but you wonder if it’s actually attracting new followers to your account. You’re putting in the effort, but you’re unsure what’s resonating with your viewers.
Instagram Reels analytics change that. They show you exactly what’s earning attention, what’s falling flat, and what to do next.
We’ve helped thousands of real estate agents figure out exactly what’s working on Instagram, and it always starts with understanding your data. And now we’re building Coffee & Contracts analytics, so you can track what's working without ever leaving the platform.
This guide breaks it all down so you can stop guessing and start creating content that actually converts.
What are Instagram Reels Analytics?
Instagram Reels analytics is the built-in performance data Instagram provides for every Reel you post. Think of it as your content report card, except instead of grades, you get real numbers that tell you what’s landing with your audience, attracting new followers, and what’s getting scrolled past.
Your Reels analytics pull together key metrics across four areas:
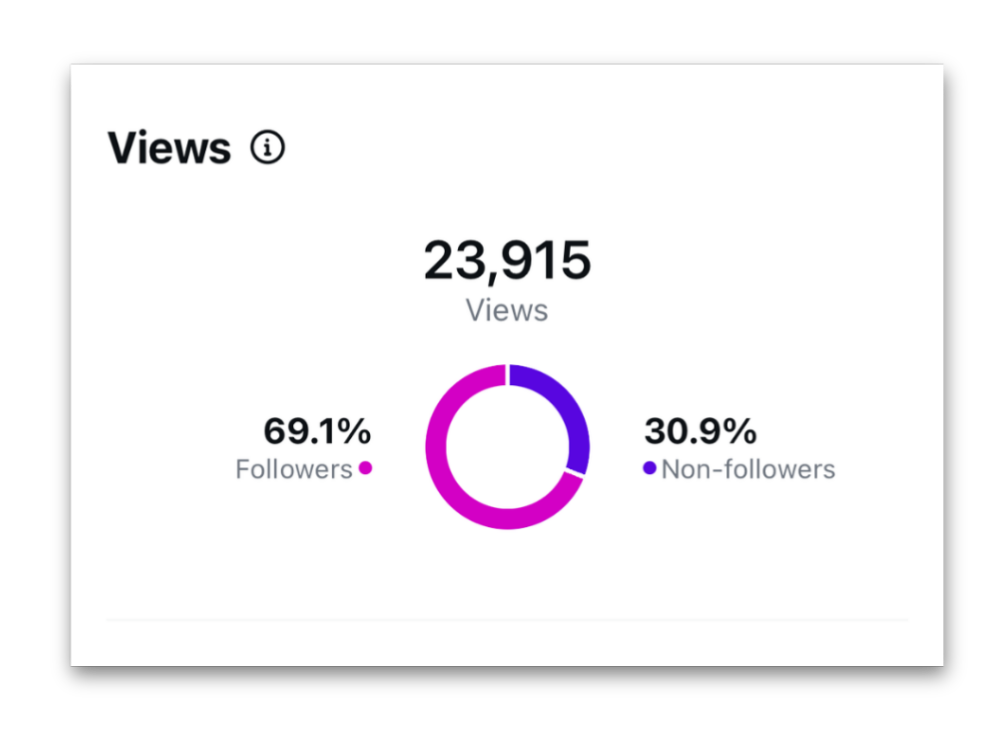
- Views and watch time: how many times your Reel was played, how long people watched, and where they dropped off
- Reach and discovery: how many unique accounts your Reel reached and how they found it (followers vs. non-followers)
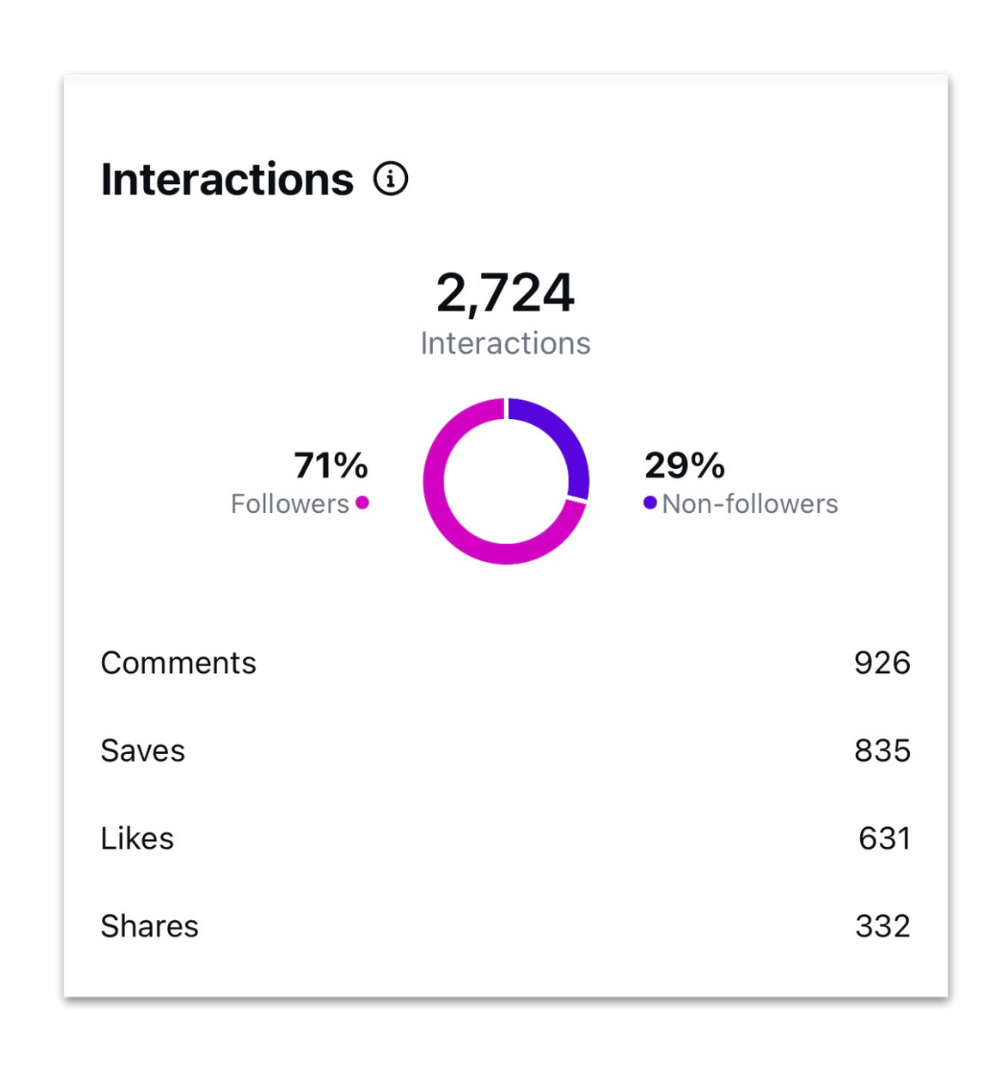
- Engagement: likes, comments, saves, and shares that show whether your audience is actively engaging or just passively scrolling
- Audience growth: how many new followers each Reel directly earned you
When you regularly track these numbers, you can identify trends, understand audience preferences, and know exactly which types of Reels are worth doubling down on.
Key Instagram Reels metrics to track
Whether you’re a real estate veteran or just starting with Instagram Reels, your success depends on your ability to track and understand what the numbers are actually telling you. These aren’t vanity stats. Every metric is a signal. And when you know how to read them, your Reels strategy gets sharper with every post.
Views
Views show you how many times your Reel has been played. They’re your baseline measure of reach and initial appeal. That’s like your first filter: low views usually mean your hook or your Reel’s visibility in the algorithm needs work.
How to use this metric: If a specific Reel is getting significantly more views than your others, look at what you did differently. That’s your signal to create more of that content. Low views across multiple Reels usually indicate it’s time to revisit your hooks, clip tempo, video quality, or posting consistency.
👉Learn how to get more views on Instagram Reels as real estate agents.
Watch time
Watch time is the total cumulative time your Reel has been played, including replays. The more time people spend watching, the more Instagram pushes your Reel to new audiences.
How to use this metric: High watch time on a Reel means that’s a format worth repeating. Use those high-performing Reels as your benchmark when creating Reels going forward. Get more repeatable content ideas for real estate agents to grow on Instagram.
Average watch time
Average watch time is the time spent playing your Reel divided by the number of initial views. An initial view counts the first time someone plays your Reel in a Reel session.
How to use this metric: Low average watch time means people are dropping off early. If you’re seeing this pattern across multiple Reels, focus on leading with your most compelling clip or strongest point first. The goal is to keep that number as close to your Reel’s full length as possible.
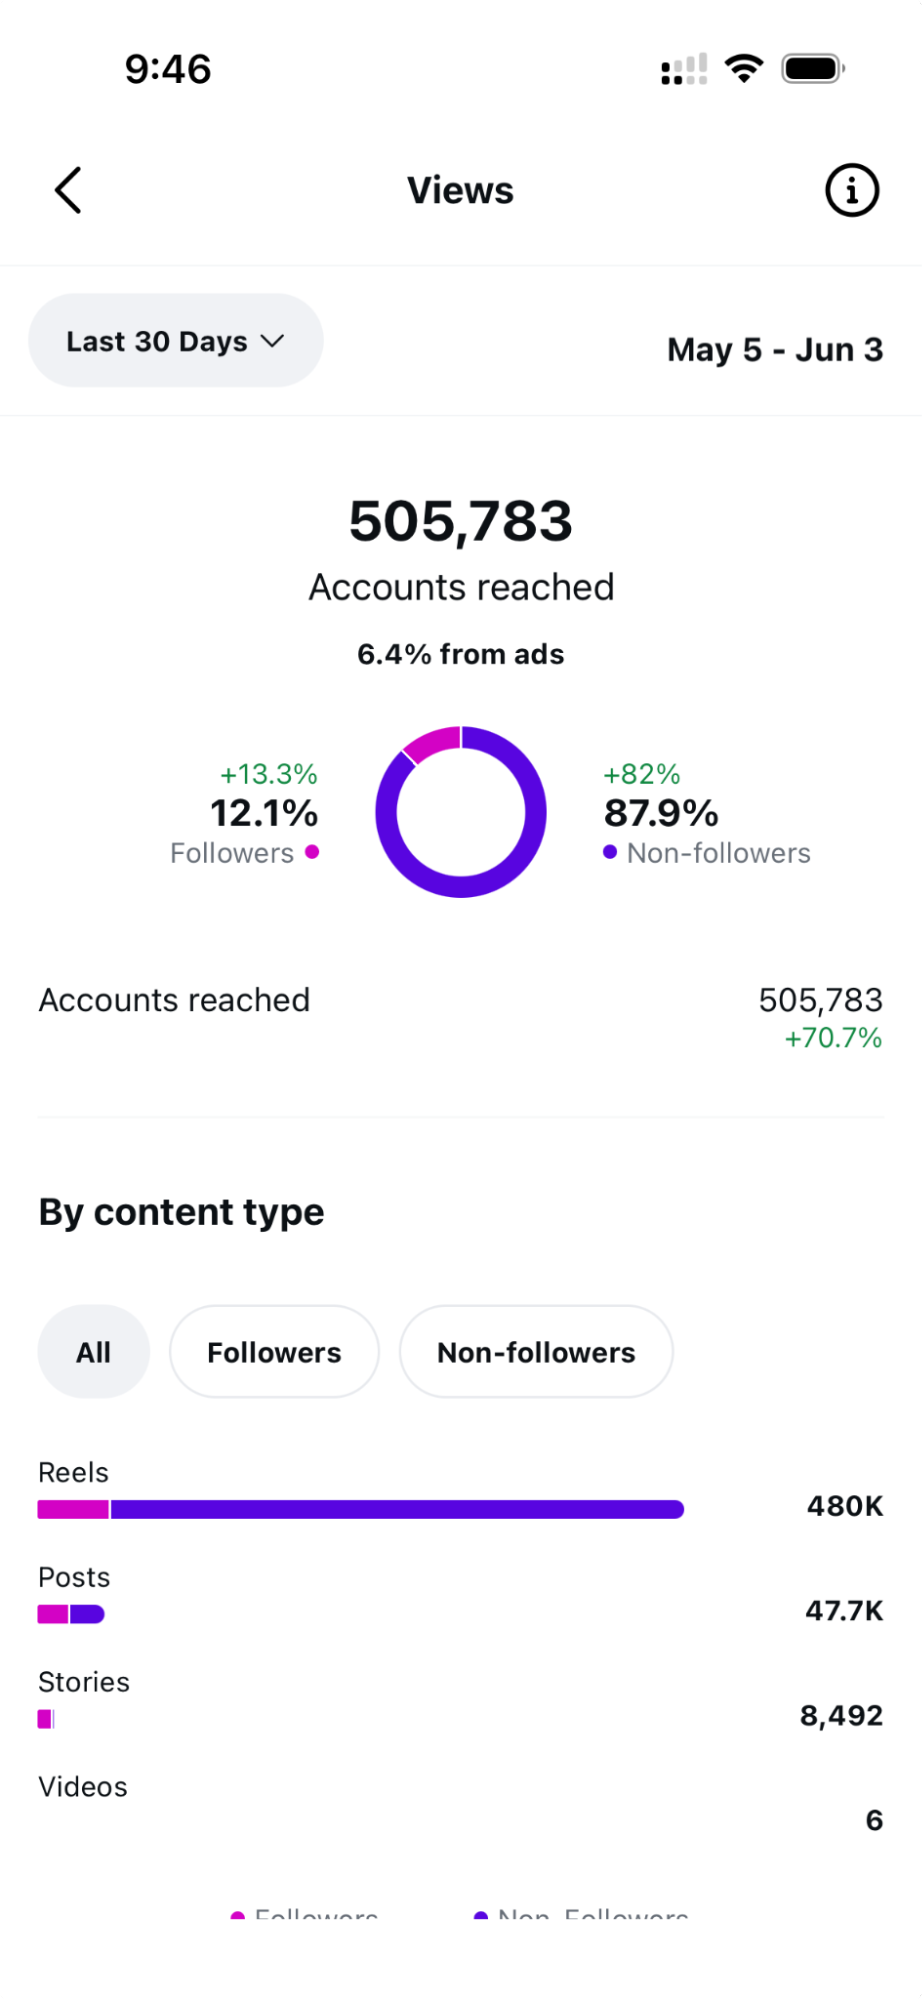
Accounts reached
This is the number of unique accounts that saw your Reel on screen at least once. It is different from views, which can count the same accounts multiple times. Reach tells you how many unique accounts your content got in front of, and includes demographic breakdowns like top countries, top cities, age range, and gender.
How to use this metric: Growing accounts reached over time means your content is finding new audiences. If reach is flat, experiment with different content formats, topics, or posting times to push your Reels beyond your existing followers.
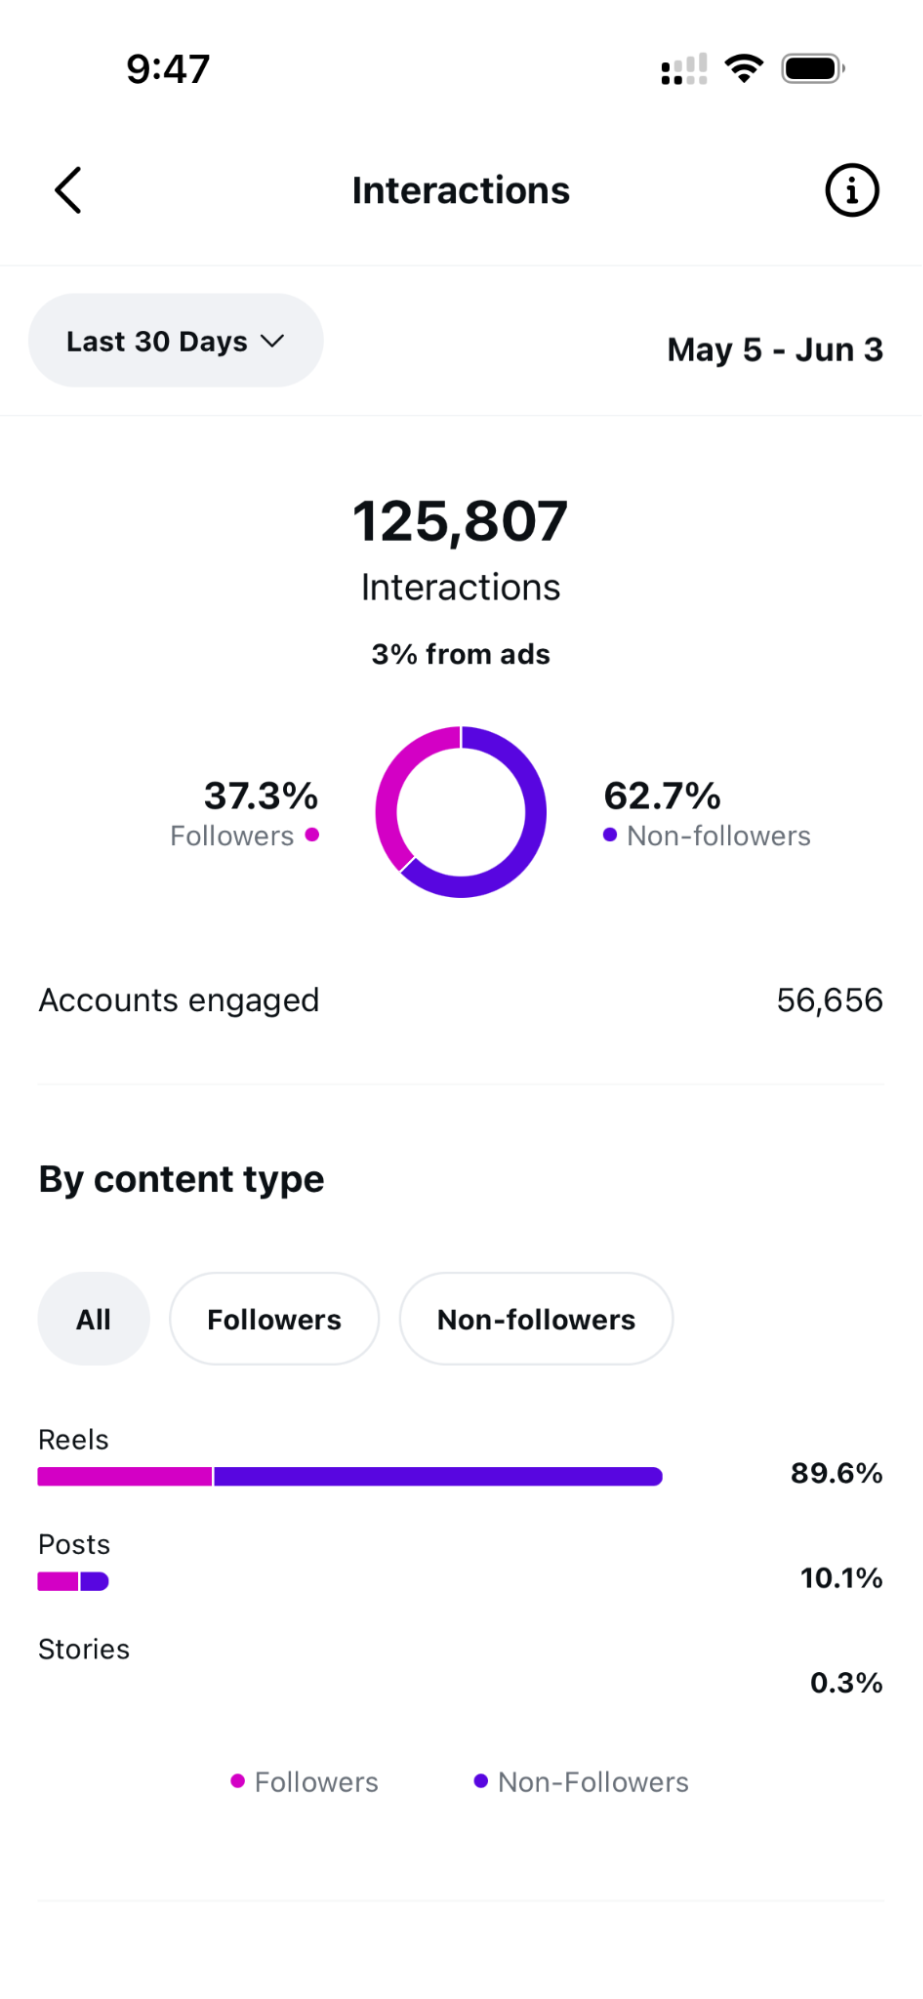
Engagement rate
Engagement rate measures how actively your audience is interacting with your content relative to your reach. It combines likes, comments, saves, and shares into a single metric and is one of the clearest indicators of whether your content is resonating or just being passively watched.
How to use this metric: A high engagement rate means this Reel topic or format is hitting. A low engagement rate, despite decent views, means people are watching but not feeling compelled to act. Add a stronger hook, call to action, ask a question in your caption, or make your content more specific to your audience’s preferences.
Likes, comments, saves, and shares
These are the engagement metrics that show whether your audience is passively scrolling or actively responding.
- Saves mean someone found your content valuable enough to return to.
- Shares mean they wanted someone else to see it, which pushes your Reel to new audiences organically.
- Comments and likes signal real-time engagement and tell the algorithm your content is worth distributing further.
How to use these metrics: Pay close attention to which Reels earn the most saves and shares. If a Neighborhood Guide or Market Update Carousel post is getting saved consistently, that's a content pillar worth building on. More saves and shares mean better Reel performance and wider reach over time.
Follows
Follows track how many accounts started following your Instagram account directly from your Reel. This metric connects your content directly to follower growth and tells you which Reels are converting viewers into followers, not just collecting views.
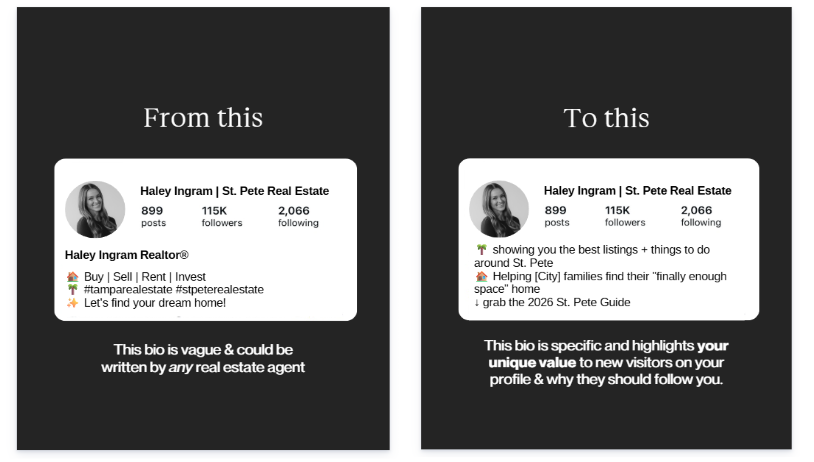
How to use this metric: If a specific Reel drove a spike in follows, study it. What was the topic? How did you open? Those are the ingredients to replicate. Getting views but very few followers usually means your profile isn’t converting. Check your bio, highlights, and feed to make sure new visitors have a clear reason to stay.
Here’s an example of how you can rewrite a generic bio into a specific value proposition to attract followers.
Here’s an example of how you can rewrite a generic bio into a specific value proposition to attract followers.
Click-through rate
Click-through rate (CTR) is one of the performance metrics that measures the percentage of viewers who tapped your CTA link, whether that’s the link in your bio, a landing page for a listing, or a lead capture form. Unlike the metrics above, CTR doesn’t show up in your Instagram insights. You can track it through your bio link tool, landing page analytics, or CRM.
To calculate it: divide your link clicks by total views, then multiply by 100. So a Reel with 50 clicks and 2,500 views has a CTR of 2%.
Here’s how to read your numbers:
- 0.5% to 3%: average range for Instagram CTR
- Above 3%: strong. Your CTA is doing real work
How to use this metric: A high view count with a low CTR means people are watching, but your CTA isn’t compelling enough to act on. Rework the CTA itself, make it more specific. For example, “DM me NEIGHBORHOOD for the full guide” beats “link in bio.” Rethink whether the offer matches what your viewers actually want.
Conversion rate
Conversion rate measures the percentage of viewers who completed a specific action you aimed for, such as making a purchase, signing up for a newsletter, or requesting more information. It's a pivotal metric for measuring the actual ROI of your Reels.
Like CTR, this one isn’t in your Instagram insights. You can pull it from your landing page analytics, form tool, or CRM, depending on the action you’re tracking.
To calculate it: divide the number of people who completed the action by total Reel views, then multiply by 100. A Reel with 1,250 views that drove 100 clicks to a landing page has an 8% conversion rate for that step.
The right benchmark depends on what you're asking viewers to do. Here’s roughly what to expect for common real estate goals:
- Property inquiries: 1% to 5%
- Website visits: 1% to 5%
- Appointment bookings: 1% to 5%
- Lead generation (email signups, gated content): 5% to 10%
- Virtual tours: 5% to 10%
How to use this metric: Higher-friction asks (booking a showing, scheduling a consultation) usually have a lower conversion rate. Lower-friction CTAs (downloading a free guide, signing up for a newsletter) have higher conversions. Leveraging insights from your conversion rate lets you make data-driven decisions about which Reel topics, hooks, and offers are moving your business forward. If your conversion rate is below the range for your specific goal, the gap is usually in one of three places: your CTA isn’t clear, your landing page isn’t doing its job, or the Reel and the offer don’t match.
How these metrics connect to your reach on Instagram
Not only do these numbers show you how your reel performed, but they also influence how many people Instagram shows your content to next.
Discovery
Discovery tracks how people are finding your Reels beyond your existing followers. Instagram builds interest profiles based on what people search, watch, and engage with. When your Reel matches those signals, Instagram surfaces it to the right people. Topic clarity and relevant keywords in your captions directly impact this.
What this means for you: Think about what your ideal client already enjoys consuming on Instagram. It may be an ABC guide to a [City] or the Top Rare Listings in [City name]. What we have found is that local Reels work the best for discovery, as locals share such content the most. A few templates that our members use include:
- POV: You live in [City Name], so the next 3 months are about to look like this
- No one can convince me that ___ is better than this. 📍 [City Name]
- Hear me out: [relatable local statement]

Get this template for your next Reel
Algorithm insights
Instagram’s algorithm rewards content that keeps people watching, earns interactions, and gets shared and saved. Watch time, engagement rate, topic clarity, and posting consistency all factor into how widely your Reels get distributed. The agents winning on Instagram right now are creating content that’s specific, local, and genuinely useful to their ideal client. That’s what earns the watch time and engagement metrics the algorithm responds to.
What this means for you: Focus on relevance over virality. Create Reels your ideal client actually wants to watch, save, and share. It builds trust and keeps people coming back to your account for more.
Why You Should Track Reels Analytics
Tracking Instagram Reels analytics helps real estate agents understand what’s working, who their content is reaching, and how to turn Instagram activity into real business results. It helps you understand how the audience is engaging with your content.
1. Know what’s working (and what’s not)
Every real estate agent has unique strengths and areas for improvement when it comes to creating Reels. Tracking Reels analytics allows you to pinpoint exactly what those are for your specific audience.
Are your property tours getting impressive Reels performance? Do your Reel insights show that viewers tend to drop off halfway through your videos? Identifying these strengths and weaknesses helps you focus your efforts where they matter most, ensuring that every Reel you produce is a step closer to your marketing goals.
2. Get to know the people watching your content
Reels analytics offer a window into your viewers’ behaviors and audience preferences. You can gain audience insights about the demographics of your audience, such as age, gender and location. This allows you to tailor your content strategy to better resonate with your target market.
Additionally, you can determine which Reels are driving the most engagement, giving you a clear picture of what interests your audience and what they find valuable. Using such insights, you can craft Reels that appeal to your current followers as well as attract new followers who are the right fit.
3. Post when your audience is actually online
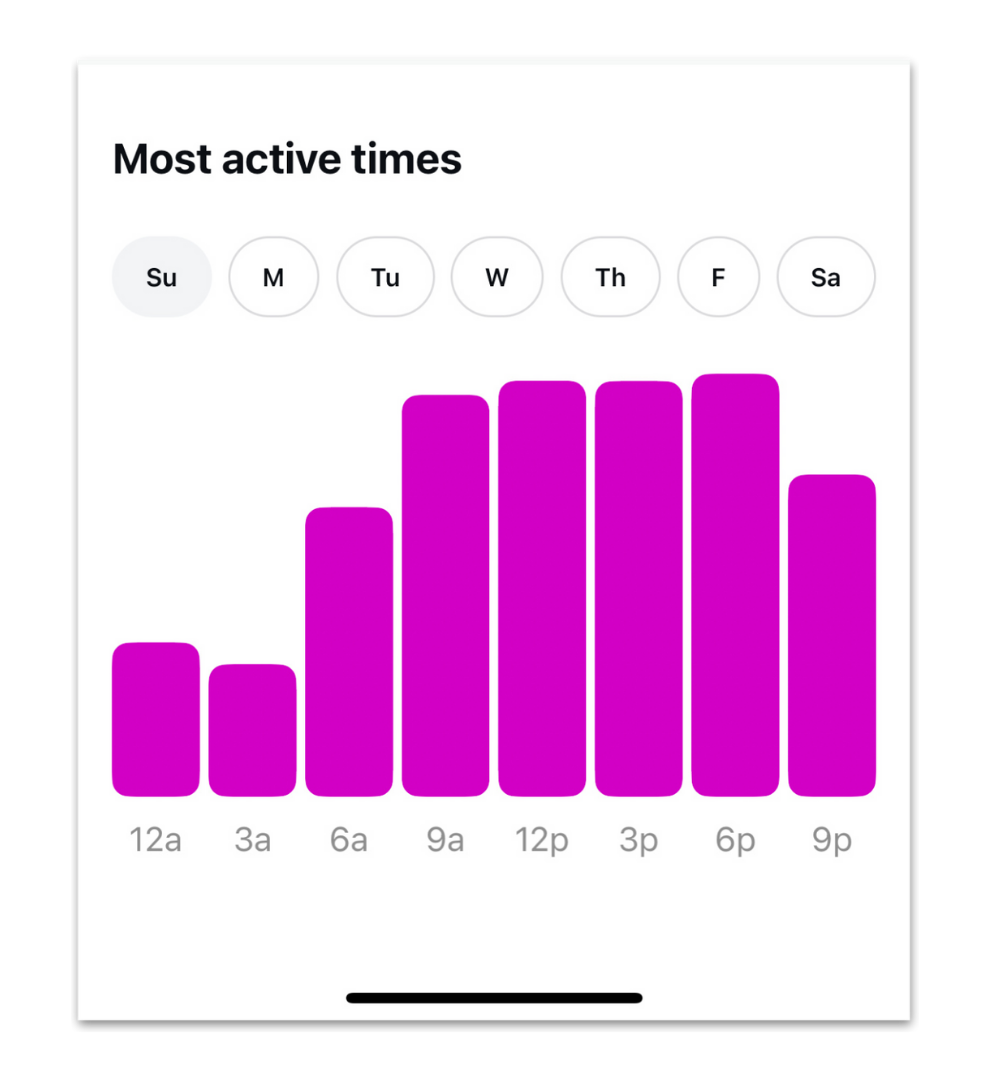
Timing is everything! The timing of your Reel posts can significantly impact their Reel performance and engagement. Instagram Reels analytics provide data on when your followers are most active on the platform.
By aligning your posting schedule with these peak times, you can ensure that your Reels have a better chance of appearing in your audience’s feeds when they’re most likely to see and engage with them. This optimization can lead to increased views, likes, comments, and new followers, ultimately boosting your real estate marketing efforts on Instagram.
4. Connect your content to real results
Real estate marketing efforts MUST translate into tangible results, and Instagram Reels are no exception. Reels analytics offer a critical tool for measuring the Return on Investment (ROI) of your content strategy. You can track Reels metrics like views, likes, comments, and engagement rate to assess the effectiveness of your Reels campaigns.
Not every reel has the same goal. The goal for local or relocation reels is to attract new eyes to your account. The goal of listing reels is to get people to share the reel with their friends and family and, ultimately, to reach out for more information.
Reels, compared to other marketing spend like ads, Zillow leads, or print mailers, have the potential for a strong ROI.
5. Create more of what your audience engages with
Knowing audience preferences is key to guiding your Reel strategy and what content to post next. Instagram Reels insights provide valuable data on which types of content resonate most with your viewers.
Are they engaging more with property tours, local business, and neighborhood spotlights, or face-to-camera authority-building Reels? By identifying these preferences, you can tailor your Reels strategy to create more of what your audience LOVES. This not only keeps your current followers engaged but also attracts new audiences who share similar interests. And that’s how follower growth compounds over time.
Ready to start using your data? Here's exactly how to find it.
How to Access Instagram Reels Analytics
To access Instagram Reels analytics, you need a Business or Creator account on Instagram. From there, you can view insights on individual Reels or access your full account analytics through the Insights section on your Instagram profile.
Step 1: Switch to a Business or Creator Account
First things first. Make sure you’re using either a Business or Creator account on Instagram. Instagram Reels analytics are not available on personal accounts, so if you’re still there, you’re posting without any visibility into your Reels performance. Switching is free, takes about two minutes, and is non-negotiable if you’re serious about your Reels strategy.
To make the switch:
- Go to your Instagram profile → Settings and Privacy
- Scroll down to Account Type and Tools
- Select Switch to Professional Account and choose your category
You’ll have the option to choose a Creator or Business account. And just like that, you're official!
Both give you full access to Instagram Reels analytics and the professional dashboard.
Step 2: View Insights on a specific Reel
Every specific Reel you post comes loaded with data that can help you refine your content strategy.
To view insights on an individual Reel, go to that Reel on your Instagram profile, tap the three dots in the bottom right corner, and select View Insights. You’ll see a full breakdown of that Reel’s performance, including views, watch time, average watch time, reach, interactions, and follows all in one place.
This is where you’ll spend most of your time evaluating your Instagram Reels performance, spotting patterns, and figuring out which content is earning attention and which is getting scrolled past.
Step 3: Access analytics via the Insights section
Beyond analyzing a specific Reel, the Insights section gives you a detailed overview of your entire Reels strategy. This bird’s-eye view is essential for tracking long-term trends, understanding audience insights, and making bigger strategic decisions about your real estate marketing on Instagram.
find it, tap the hamburger menu in the top right corner. Choose the Insights option. It’ll show you data from the last 7 days, but you can adjust the date range to pull historical data and see how your multiple Reels are performing over time. This is also where you’ll find your account insights, including follower growth, unique accounts reached, and deeper engagement data across your content.
Bonus: How to fix Reels Insights not showing
If your Reel insights aren’t appearing, a couple of things could be happening.
The most common reason: You’re still under a personal account, where Instagram's native analytics simply aren't available.
You may need to log out and back into your Business or Creator account to reset the display, or re-authenticate your account in Settings.
Once you have your data, here’s exactly how to use it.
How to use Reels analytics to improve your strategy
Instagram Reels analytics are only useful if you actually act on what they’re telling you. Knowing your metrics is step one. Using that data to make smarter decisions about your content strategy is where real growth happens. Here are three ways to put your Reels insights to work.
Double down on what’s already working
Go into your Instagram profile insights and sort your Reels by reach, watch time, or follows gained. Look for the ones that clearly outperformed the rest and study them. What was the topic? What was the hook? How were the clips? What format did you use—talking head, listing Reel, local business spotlight?
If your local Reels consistently outperform your market update Reels in both reach and new followers, that's a clear indicator of your audience's preferences. Double down on local content and use it as the foundation of your Reels strategy going forward.
Fix low average watch time
If your average watch time is low, people are leaving before your Reel has a chance to land. This is one of the most actionable insights your Instagram Reels analytics can give you because the fix is almost always in the first two seconds. Your hook isn’t strong enough to stop the scroll, your clips are too long, low quality, or the subject of the video is not compelling enoughPull up your lowest-performing Reels and ask: what’s the very first thing someone sees? Is it a slow pan in the living room? A text-heavy visual? Lead with your best clip or your most visually striking moment. Give people a reason to stay before they even decide to.
If a listing Reel has a low average watch time, use your hook to focus on the most compelling feature or benefit of the home. Maybe it’s a unique feature, proximity to a local amenity, or an aspirational lifestyle that the home would allow. Maybe it’s the price, potential, and ability for the next owner to make it their own.

Get this template for your next listing feature Reel
Members love our Reels Course, which covers hook strategy, the gear you’ll need, and best practices for filming. Learn more about The Reel Guide course to create the perfect Reels.
Track new followers per Reel
Views feel good, but follows is what we’re after. Tracking how many new followers each specific Reel drives tells you which content is actually getting people to stick around for more. This is the metric that connects your Reel’s performance directly to audience growth.
Look at which Reels brought in the most new followers and compare them to Reels with similar view counts but fewer follows. The difference usually comes down to relevance and profile alignment. The right content attracts the right people who look at your profile and immediately think, “I need to follow this person.”
When you know which Reels are earning the most followers, you stop wasting time on content that doesn’t. When you fix your watch time, more people stay long enough to hear what you have to say. And when you double down on what’s already working, your content strategy starts building real follower growth.
But all of that depends on reading your data right in the first place.
Common pitfalls to avoid when reading your Reels analytics
We all make mistakes and that’s okay. Identifying these pitfalls is the first step toward avoiding them and maximizing the potential of your Instagram Reels strategy.
Confusing reach with views
Reach is the number of unique accounts that saw your Reel at least once. Views count every play, including replays and multiple accounts watching more than once. A Reel can pull thousands of views from a relatively small reach if your existing followers keep rewatching it. The time spent replaying Reels signals to Instagram that your content is worth pushing to more people.
Tip: If you’re judging audience growth by view count alone, you’ll overestimate how many new people actually saw your content. Cross-check views against accounts reached to know the entire story.
Chasing vanity metrics
Likes and follower count don’t tell you whether your content is doing real work, like saves and shares, which show how your audience interacts with your content. A Reel with 500 likes and zero saves is a Reel people watched and scrolled past. A Reel with 200 likes and 80 saves is content people want to return to or send to someone else.
Tip: Optimize for what compounds. Saves and shares push your Reels into new feeds, which is how reach grows beyond your existing followers. Comments build relationships and signal to the algorithm that your content is worth distributing. So, build your strategy around them.
Skipping competitor analysis
Your detailed insights tell you how your content is performing against your own baseline. But a quick competitor analysis, especially of the agents who consistently get strong engagement, shows you formats, hooks, and topics you haven’t tried yet.
Tip: Save five to ten Reels a week from agents whose content you’d want to study, and review them at the end of the month. Look for what they’re doing differently in their hooks, their B-roll, their captions, and their CTAs.
Analyzing all your Reels together
Treating all your Reels as one pile hides patterns that drive real decisions. Your overall engagement rate might look solid, but that average can mask a category that’s pulling its weight while another flops. Without segmenting, you can’t tell what’s carrying your strategy and what’s dragging it down.
Tip: Group your Reels by category (listing tours, local spotlights, market updates, face-to-camera tips) and compare performance inside each group. Open the Reels tab, sort Reels by saves or follows gained, and notice how many Reels in each category are earning their place.
Reading your data right is one half of the job. The next part is knowing how the algorithm works so you can refine your strategy.
How does the Instagram algorithm rank Reels (and what you can control)?
The Instagram algorithm ranks Reels based on six key factors: interest, timeliness, relationship, frequency, following, and usage. Understanding each one gives you a clearer picture of what to focus on to improve your Reels performance and reach new audiences consistently.
Interest
Instagram predicts how likely someone is to engage with your Reel based on what they’ve watched, liked, saved, and shared in the past. The more your content matches a viewer’s existing interests, the more likely Instagram is to show it to them. This is why topic clarity matters so much. If Instagram can’t quickly classify what your Reel is about, it struggles to match it to the right audience.
How to use this info: Be specific. A Reel about “[City Name] neighborhoods near top-rated schools” will find its audience faster than a vague market update. Use your captions, hooks, and on-screen text to clearly signal what your content is about and who it’s for.
Timeliness
Instagram prioritizes recent content. A Reel posted today will get more distribution than one posted two weeks ago. This is why posting consistency matters. Fresh content signals an active, relevant account.
How to use this info: Build a realistic posting schedule and stick to it. You don’t need to post Instagram Reels every day. But showing up consistently, whether that's three times a week or five, trains both the algorithm and your audience to expect your content.
👉Check out this 7-day real estate marketing checklist for more content ideas.
We make consistent posting easier for our members by offering them a personalized content strategy and weekly posting schedule. This takes the guesswork out of what to post and when.
Relationship
Instagram gives more weight to content from accounts that a user has interacted with before. If someone has liked, commented on, or shared your Reels in the past, they’re more likely to see your future posts. This is why engagement isn’t just a vanity metric; it’s a relationship signal that directly impacts your reach.
How to use this info: Reply to every comment. Respond to DMs. Engage with your followers’ content too. The more two-way interaction you build, the stronger your relationship signals become and the better your Reels perform over time.
Frequency and usage
These two factors work together. Frequency refers to how often a user opens Instagram, and usage shows how long they spend in a session. Users who open the app more frequently and spend more time on the app get exposed to a wider range of content, including Reels from accounts they don’t follow yet. Together, these signals determine how much content Instagram serves someone and how broadly it distributes yours.
How to use this info: Consistency and quality both matter here. Show up regularly enough that your content is always in the mix, and make sure every Reel is strong enough to earn attention, whether someone opens Instagram for two minutes or twenty. Local, relocation, and listing content Reel tends to travel furthest because it’s relevant to a wider range of people, including those who don’t already follow you.
Following
The more accounts a user follows, the more competition your content has for their attention. If someone follows hundreds of accounts, your Reels are competing with more content for the same screen time. This makes your hook critical for stopping the scroll.
How to use this info: Lead with your strongest moment. Whether it’s a bold statement, a surprising fact about a local market, or a visually striking opening clip, your Reel needs to earn attention immediately. If it doesn’t stop the scroll in the first two seconds, it gets buried.
This is exactly where a solid Reels strategy pays off. When you understand what the algorithm is looking for, you stop creating content randomly and start creating with intention. Our Coffee & Contracts membership gives you ready-to-use templates, hooks, and captions built around these exact signals so you can show up consistently with content that’s designed to perform, not just fill your feed.
Read more: A guide to Instagram Reels for real estate agents
Phew! That’s a wrap. You now know what Instagram Reels analytics are, how to access them, which metrics actually matter, and how to use that data to make smarter content decisions. But knowing what to track is only the beginning. The next step is to start tracking and making changes to your Reels strategy
And if you want to make every Reel you post work harder from day one, that’s exactly what Coffee & Contracts is built for. Our members get ready-to-use templates, captions, and hooks designed around the metrics and algorithm signals you just learned about, so you’re not starting from scratch every time you post.
Get a week of free content and see what consistent content that actually converts looks like.
Frequently Asked Questions
1. How do I get analytics for a specific Instagram Reel?
Open the Reel on your Instagram profile, tap the three dots in the bottom right corner, and select View Insights. You'll see a full breakdown of that Reel’s performance, including views, watch time, average watch time, accounts reached, interactions, and follows. You need a Business or Creator account to access this.
2. Why do some Reels perform better for real estate listings than others?
High-performing Reels lead with a strong visual hook and a strong text hook that speaks directly to the buyer's desires & aspirations rather than just listing features. Watch time and engagement rate are usually higher on Reels that open with high-quality, short, eye-catching visuals and the most impressive features of the home.
3. How can I measure ROI from Instagram Reels?
Track Reels metrics like new followers gained, profile visits, and DMs received after posting. Cross-reference which specific Reels drove the most follower growth and audience engagement over time. If a Reel consistently brings in new followers who convert to leads, that's your clearest signal of positive ROI.
4. How do I use Reels insights to improve posting times for real estate audiences?
Go to your Instagram profile, tap the hamburger menu, and open Insights. Under Total Followers, scroll to Most Active Times. This shows you the days and hours your audience is most active. Align your posting schedule with those windows to maximize reach and Reels performance.
5. Which Reels content types drive the most engagement for realtors?
Listing Reels with strong hooks, and local lifestyle content consistently drive the highest engagement and follower growth for real estate agents. Content that's specific to a city or neighborhood reaches new audiences faster because it matches what locals and relocation clients are already searching for on Instagram.
6. Can I access Instagram Reels analytics on a personal account?
No. Instagram Reels analytics are only available on Business or Creator accounts. If you're still on a personal account, you have no visibility into your Reels performance, watch time or audience insights. Switching to a professional account is free and takes less than two minutes.
7. Can I export Instagram Reels analytics data?
Instagram’s native analytics don’t offer a direct data export for Reels insights. To pull custom reports or export historical data, you’ll need a third-party tool like Hootsuite, Sprout Social or Flick. These tools give you deeper insights and more flexible reporting than Instagram's built-in analytics alone.

More like this

Instagram marketing for realtors: Proven strategies to build your brand and generate more leads

Social media templates to generate high-intent real estate leads on Instagram